Friday, May 25, 2012

Fractals

Here is another concept familiar to charts watchers of technical anaylsis and students of human nature as it applies to trading.

Fractal

From Wikipedia, the free encyclopedia
Jump to: navigation, search
Figure 1a. The Mandelbrot set illustrates self-similarity. As you zoom in on the image at finer and finer scales, the same pattern re-appears so that it is virtually impossible to know at which level you are looking.
Figure 1b. Mandelbrot zoomed 6x
Figure 1c. Mandelbrot zoomed 100x
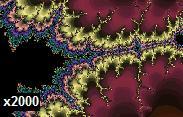
Figure 1d. Even 2000 times magnification of the Mandelbrot set uncovers fine detail resembling the full set.
A fractal is a mathematical set that has a fractal dimension that usually exceeds its topological dimension[1] and may fall between the integers.[2] Fractals are typically self-similar patterns, where self-similar means they are "the same from near as from far"[3] Fractals may be exactly the same at every scale, or as illustrated in Figure 1, they may be nearly the same at different scales.[2][4][5][6] The definition of fractal goes beyond self-similarity per se to exclude trivial self-similarity and include the idea of a detailed pattern repeating itself.[2]:166; 18[4][7]
As mathematical equations, fractals are usually nowhere differentiable, which means that they cannot be measured in traditional ways.[2][6][8] An infinite fractal curve can be perceived of as winding through space differently from an ordinary line, still being a 1-dimensional line yet having a fractal dimension indicating it also resembles a surface.[1]:48[2]:15
The mathematical roots of the idea of fractals have been traced through a formal path of published works, starting in the 17th century with notions of recursion, then moving through increasingly rigorous mathematical treatment of the concept to the study of continuous but not differentiable functions in the 19th century, and on to the coining of the word fractal in the 20th century with a subsequent burgeoning of interest in fractals and computer-based modelling in the 21st century.[9][10] The term "fractal" was first used by mathematician Benoît Mandelbrot in 1975. Mandelbrot based it on the Latin frāctus meaning "broken" or "fractured", and used it to extend the concept of theoretical fractional dimensions to geometric patterns in nature.[2]:405[7]


Two different charts::::


Is there a difference in these charts?  They are the same stock. The first is a 4 day chart of 5 minute bars. The 2nd is a 6 year chart where each bar represents a week.
Trading using technical analysis is effective over many timeframes. It is up to the trader/investor to find the timeframe that fits their personality and risk tolerance.
 
Just thinking,
gh 

Saturday, May 12, 2012

Tea leaves! May 12, 2012

The stock markets seem weak lately. I don't see much buying in the intraday price movements. The latest weakness increased following the employment report a couple weeks ago. Those numbers showed a continuing lack of job creation in the US economy. After all this time one would expect jobs to show up. This further enforces the notion of a "structural" employment problem. I think this structural problem that they talk about is due to the hollowing out of the middleclass and the polarization in income that has occurred over the last 20 years or so.  When people don't have money to spend and they have gone deeper in debt than they should, they don't spend. Another significant part of the "structural" problem is demographics. The baby boomer generation is starting to retire. And those that haven't retired are facing the prospect of retiring with inadequate money to retire on. Add to this the talk of the insolvency of the Social Security system and there is an urgency to save.

And given the above points and considering the fact that the US Federal Reserve has used up much of their stimulative ammunition with little result is it any wonder to expect weakness in corporate profits on the horizon. Remember, the stock markets are FORWARD looking. Profits may be strong now, but what will the future look like. On the world stage there is the increasing likelihood that China is experiencing a slowdown and is at risk of a full blown crash due to the property price run-up that they have had.
With all that being said there are points that indicate a lack of selling urgency in the stock markets. So far at least. The volume has not increased to a level that indicates any kind of panic. But the panic comes as the downtrend continues. So it is early. In my opinion I would not be long of the markets until they make new highs and stay there for a couple weeks at least. I point this out in the small cap chart in this post..... A move higher would be very surprising and for that reason would be a good reason to buy. When a market has every reason to go down, and then goes up, is bullish. Regardless of MY personal opinion!

Here are some charts.


It is folly to trade from the long side when the markets are trending down. (That is another reminder to myself!)

Control risk.
gh

Friday, May 4, 2012

Where will those fleeing the Euro go?

The Euro is heading for a cliff. What will those still holding Euros do to save value? Gold has been week lately... Dollar is looking strong. Stocks weak. Oil is falling fast. Gasoline going down.
Does the market see demand destruction?
We could see another flash crash soon.....Or not....

France is going to elect a socialist president in the coming days. This is the backlash against the "austerity" programs in Europe. Will the Eurozone break up over the desire to print money vs. the mostly German wish to hold the currency up at the expense of the rest of Europe???
Here is the chart.
Control risk.
gh