Fractal
From Wikipedia, the free encyclopedia
For the popular art form, see Fractal art.
This audio file was created from a revision of the "Fractal" article dated 2005-06-16, and does not reflect subsequent edits to the article. (Audio help)
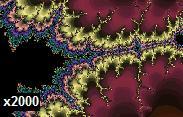
Figure 1a. The Mandelbrot set illustrates self-similarity. As you zoom in on the image at finer and finer scales, the same pattern re-appears so that it is virtually impossible to know at which level you are looking.
A fractal is a mathematical set that has a fractal dimension that usually exceeds its topological dimension[1] and may fall between the integers.[2] Fractals are typically self-similar patterns, where self-similar means they are "the same from near as from far"[3] Fractals may be exactly the same at every scale, or as illustrated in Figure 1, they may be nearly the same at different scales.[2][4][5][6] The definition of fractal goes beyond self-similarity per se to exclude trivial self-similarity and include the idea of a detailed pattern repeating itself.[2]:166; 18[4][7]
As mathematical equations, fractals are usually nowhere differentiable, which means that they cannot be measured in traditional ways.[2][6][8] An infinite fractal curve can be perceived of as winding through space differently from an ordinary line, still being a 1-dimensional line yet having a fractal dimension indicating it also resembles a surface.[1]:48[2]:15
The mathematical roots of the idea of fractals have been traced through a formal path of published works, starting in the 17th century with notions of recursion, then moving through increasingly rigorous mathematical treatment of the concept to the study of continuous but not differentiable functions in the 19th century, and on to the coining of the word fractal in the 20th century with a subsequent burgeoning of interest in fractals and computer-based modelling in the 21st century.[9][10] The term "fractal" was first used by mathematician Benoît Mandelbrot in 1975. Mandelbrot based it on the Latin frāctus meaning "broken" or "fractured", and used it to extend the concept of theoretical fractional dimensions to geometric patterns in nature.[2]:405[7]
Two different charts::::
Is there a difference in these charts? They are the same stock. The first is a 4 day chart of 5 minute bars. The 2nd is a 6 year chart where each bar represents a week.
Trading using technical analysis is effective over many timeframes. It is up to the trader/investor to find the timeframe that fits their personality and risk tolerance.
Just thinking,
gh


No comments:
Post a Comment
All comments are appreciated as it will give me a chance to adjust my content to any real people who may be out there. Thank you. gh